Student and School Demographics
Page Description
What is the data source for enrollment figures?
Enrollment graphs show both fall and spring counts for an academic year. The Georgia Department of Education collects enrollment counts from school systems periodically throughout the year. These collections are known as FTE (Full-Time Equivalency) counts. Fall enrollment figures are based on the October FTE count and the spring enrollment figures are based on the March FTE count. The enrollment figure presented at the top of each page for a school, system, or the state reflects the October FTE data. Previous years' information is based on October FTE collections from the corresponding years.
What is the source of the percentage of economically disadvantaged students?
This percentage is calculated by dividing the number of students eligible to receive free or reduced-priced meals (as reported to the Georgia Department of Education in the October Nutrition Count) by the total school enrollment (as reported by the October FTE count). Previous years' information is based on the October FTE collections from the corresponding years.
What is the data source for the percentage of students with disabilities?
The percentage of students with disabilities is based on the December FTE (Full-Time Equivalency) count divided by the total enrollment from the Fall FTE count. These students must also be enrolled during October FTE. The December FTE has been declared the official count of students with disabilities.
What is the data source for the percentage of students with limited English proficiency?
The percentage of students who are English Language Learners (ELL) is based on Student Record data. GaDOE calculates this percentage from the count of students identified as ELL divided by the count of students identified at that school, system, or state anytime during the academic year according to Student Record data.
What is the data source for the percentage of migrant students?
The percentage of migrant students is based on Student Record data. GaDOE calculates this percentage from the count of students identified as enrolled in the Migrant Education Program divided by the count of students identified at that school, system, or state anytime during the academic year according to Student Record data.
Who is a retained student?
A retained student is one who is reported in the October FTE as being in the same grade for the current academic year as he/she had been in the previous academic year. The report shows numbers for each race/ethnicity category and for male/female. The percent is based on the disaggregation group.
What are Selected Programs?
This section of the Report Card shows data on programs in which students may enroll. The following briefly describes the various selected programs:
Gifted: The number of students enrolled in the Gifted Program, as reported by an unduplicated count of the October and March FTE. Gifted students meet state eligibility criteria for gifted education and receive special instruction and/or special ancillary services to achieve at levels commensurate with their identified abilities.
Vocational Labs: The number of students in grades 9-12 enrolled in Vocational Lab courses, as reported in the October FTE count. Vocational Lab courses are state-approved and provide a laboratory component. The laboratory setting allows a significant portion of the instructional time to be spent in hands-on activities.
Alternative Programs: The number of students enrolled in an Alternative Program, as reported in the October FTE count. Alternative Programs are designed for a variety of students who may require an altered or modified educational environment. For example, Alternative Programs serve students who exhibit disruptive behaviors in the traditional school; students with "regular" status who choose to complete high school in a night school placement; or those whose academic progress may be furthered in a modified instructional program delivered in classes with smaller teacher-pupil ratios.
The Report Card reports Selected Program data as a number and as a percent of student population. The number of students enrolled in a selected program divided by the total number of students reported in the October FTE count as enrolled in the grades served by this program.
What are Compensatory Programs?
This section of the Report Card shows data on programs in which students receive special services that target areas of student needs.
Special Education: The number of students enrolled in special education classes, as reported in the December FTE count. Special Education Programs are provided for identified eligible students with one or more disabilities, including intellectual disabilities, emotional/behavior disorders, specific learning disabilities, orthopedic impairments, speech/language impairments, visual impairments, significant developmental delay, and deaf/blind disabilities. The reporting of Special Education students is broken out by students in grades K-12 and students in pre-kindergarten.
English to Speakers of Other Languages (ESOL): The number of students enrolled in the state-funded ESOL program at least one 50-60 minute segment of the day as reported in the October FTE count. ESOL students are those students who, because their native language/home language/first language is other than English, have difficulty speaking, reading, writing, or understanding the English language. ESOL students do not possess sufficient English language skills to benefit fully from the regular classroom instruction.
Early Intervention Program (EIP): The number of students enrolled in the Early Intervention Program (EIP), at least one 50-60 minute segment of the day, as reported in the October FTE count. The EIP Program is designed to serve students in the early grades (K-5) that are at risk of not reaching or maintaining academic grade level. The purpose of the Early Intervention Program is to provide additional instructional resources to help students who are performing below grade level obtain the necessary academic skills to reach grade level performance in the shortest possible time.
Remedial Education Program:The number of students enrolled in the Remedial Education Program at least one 50-60 minute segment of the day, as reported in the October FTE count. The purpose of the Remedial Education Program is to assist students in grades 6-12 as they attempt to meet academic expectations of the Georgia Performance Standards (GPS) in reading, mathematics, and writing.
The Report Card reports compensatory program data as a number and a percent of student population. The number of students enrolled in a compensatory program divided by the total number of students reported in the October FTE count as enrolled in the grades served by this program. For example, the Early Intervention Program serves only students in grades K-5. The percent of student population reports the percentage of students enrolled in EIP in grades K-5 compared to the total number of students in grades K-5 in the school.
Page Content
Each Report within this Page is listed below.
Filtering Help
Filter Screenshot
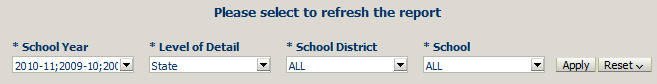
Filter Name
Filter Description
School Year
Click to change the school year(s) displayed within the reports below.
Level of Detail
Click to change the granularity (State, District, or School level) displayed within the reports below.
School District
Click to choose the school district(s) to be displayed within the reports below.
School
Click to choose the school(s) to be displayed within the reports below.
Button Name
Button Description
Apply
Click to update the reports below with the selected value(s).
Reset
Click to reset the reports below to the default or last selected values.