K-12 Public Schools
Page Description
In January of 2008, the Governor’s Office of Student Achievement (GOSA) unveiled Georgia’s Education Scoreboard. This official state Scoreboard, conceived by Governor Perdue and developed by GOSA, provides education stakeholders, i.e. parents, educators, business and government leaders, and community-based organizations, with a straightforward indication of student achievement in Georgia, from pre-kindergarten through postsecondary education.
Just as a scoreboard in an athletic competition provides fans with an at-a-glance status report, the Education Scoreboard provide stakeholders with meaningful, concise, transparent data on the quality and progress of education in Georgia. It is intended to:
Highlight to educators and parents areas in education that are especially important on which to focus;
Encourage education institutions to gauge their progress in raising student achievement as compared with other Georgia institutions, other states, and the nation;
Compel schools, colleges, and universities to implement improvement practices as necessary;
Provide businesses and families interested in moving to Georgia with clear data on the quality of education from preschool to college;
Impel all stakeholders to greater advocacy in creating quality education options in their communities; and
Grow a state culture that demands continuous educational improvement.
GOSA subjected the development of the scoreboard to a rigorous approval process. First, GOSA conducted a review of the research literature to identify critical performance indicators for elementary schools, middle schools, high schools, colleges and universities, and technical colleges.
Next, GOSA consulted members from reputed national and state education organizations for comments and recommendations on the draft indicators. Such organizations included the National Governor’s Association, the Southern Regional Education Board, the Black Alliance for Educational Options, the New Commission on the Skills of the American Workforce, the Georgia Partnership for Excellence in Education, the Georgia Public Policy Foundation, the Georgia House of Representatives, the Metro Chamber of Commerce, AT&T, Georgia Power, Governor Perdue’s Education Finance Task Force, and the Office of Planning and Budget.
Finally, GOSA solicited feedback from the leaders of Georgia’s education agencies, including the State Superintendent of Schools, the Chancellor of the University System of Georgia, the President of the Technical College System, the Commissioner of the Department of Early Care and Learning, the President of the Georgia Student Finance Commission, and the Executive Secretary of the Georgia Professional Standards Commission.
Additional Information
Indicator
Description
Source
Attendance (Elementary, Middle, High, and K-12)
Average days attended: The percentage of enrolled days for which students were present.
Sum of days present divided by sum of days enrolled for students reported in SR data collection.
For schools, this indicator is only calculated for schools with school_type_code equal to ‘E,’‘M,’ or ‘H’ in AYP_DW.AYP_School. The calculation includes all students reported by the school in SR; regardless of grade, enrollment duration, or whether the student was still enrolled at the end of the year.
For districts, this indicator considers all students reported by the district in SR that were enrolled in grades K-5, 6-8, 9-12 or K-12; regardless of enrollment duration, or whether the student was still enrolled at the end of the year.
Georgia Department of Education
AYP Status
Whether or not schools met their Adequate Yearly Progress (AYP) goals
Georgia Department of Education
Master Teachers
The number of teachers at a school who have applied for and earned Master Teacher Certification
Georgia Professional Standards Commission
3rd/4th/5th/6th/7th/8th Grade Achievement
The percent of the grade students who met or exceeded state standards in reading, language, mathematics, science, and social studies as measured by the Criterion Referenced Competency Test (CRCT).
Numerator includes all students earning an OSA_Performance_Code of ADV or PRO on all tested CRCT subject areas for this grade level.
All students with 1 or more CRCT subject area test records for this grade level are included in the denominator.
Students need not have taken all subject areas to be included in numerator, but must have obtained a score at or above the proficient level on all tested subject areas. Students who cheated on any test are included in the denominator, but not the numerator of this calculation.
Student who were present, but did not attempt any one of the CRCT test are included in the denominator, but not the numerator of this calculation.
Students who used a non-permissible accommodation on any one of the CRCT test are included in the denominator, but not the numerator of this calculation.
Georgia Department of Education
8th Grade Writing Achievement
The percent of students who met or exceeded state standards on the 8th Grade Writing Assessment.
All students with an 8th grade writing test record are included in the denominator.
Students who cheated are included in the denominator, but not the numerator of this calculation.
Student who were present, but did not attempt the test are included in the denominator, but not the numerator of this calculation.
Students who used a non-permissible accommodation are included in the denominator, but not the numerator of this calculation.
Georgia Department of Education
9th Grade On-Track Rate
The percent of first time 9th graders who took and passed the 9th Grade Literature EOCT and who were not retained.
Numerator includes all 9th grade students earning a performance code score of ADV or PRO on the 9th Grade Literature End of Course Test, were not flagged as retained in SR, and whose date of entry into 9th grade was within the 2006-2007 school year.
Denominator includes all students in SR whose date of entry into 9th grade was within the 2006-2007 school year.
Students who cheated on the 9th grade Literature EOCT are included in the denominator, but not the numerator of this calculation.
Student who were present, but did not attempt the test are included in the denominator, but not the numerator of this calculation.
Students who used a non-permissible accommodation are included in the denominator, but not the numerator of this calculation
Georgia Department of Education
AP or IB Course Participation
The number of students enrolled at a public high school in Georgia who took an Advanced Placement (AP) or International Baccalaureate (IB) course exam divided by total enrollment.
Georgia Department of Education and Governor’s Office of Student Achievement
AP or IB Course Achievement
The percent of student test takers at a Georgia public high school who earned a passing score of 3, 4, or 5 on an AP exam and/or earn a 4, 5, 6, or 7 in an IB course.
Georgia Department of Education and Governor’s Office of Student Achievement
High School Science Achievement
The percent of students passing the science portion of the Georgia High School Graduation Test (GHSGT) on the first attempt.
Numerator includes all students earning an OSA_Performance_Code of ADV or PRO on the Fall or Spring GHSGT Science Test and who were flagged as first time test takers. All 11th grade students with an 11th grade science test record and who are flagged as first time test takers are included in the denominator.
Students who cheated are included in the denominator, but not the numerator of this calculation.
Student who were present, but did not attempt the test are included in the denominator, but not the numerator of this calculation.
Students who used a non-permissible accommodation are included in the denominator, but not the numerator of this calculation.
Georgia Department of Education
College-Ready HOPE Scholars
The percent of a high school’s HOPE scholarship recipients who entered college without needing learning support.
University System of Georgia
Page Content
Each Report within this Page is listed below.
Filtering Help
Filter Screenshot
Filter Name
Filter Description
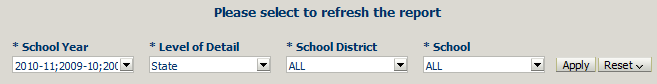
School Year
Click to change the school year(s) displayed within the reports below.
Level of Detail
Click to change the granularity (State, District, or School level) displayed within the reports below.
School District
Click to choose the school district(s) to be displayed within the reports below.
School
Click to choose the school(s) to be displayed within the reports below.
Button Name
Button Description
Apply
Click to update the reports below with the selected value(s).
Reset
Click to reset the reports below to the default or last selected values.